Now there are more post on this subject in this link, you can view all previous posts also .
More advanced statistical analysis aims to identify patterns in data, for example, whether there is a link between two variables, or whether certain groups are more likely to show certain attributes.
This is in order to draw lessons from the sample that can be generalised to the wider population.
Relationships vs differences
Research hypotheses can be expressed in terms of differences between groups, or relationships between variables. However, these are two sides of the same coin: almost any hypothesis could be set out in either way.
For example:
There is a relationship between gender and liking ice cream OR
Men are more likely to like ice cream than women.
Comparing Groups
Your first step is to identify your two or more groups. This will obviously depend on your research question or hypothesis.
So if your hypothesis was that men are more likely to like ice cream than women, your two groups are men and women, and your data is likely to be something like self-expressed liking for ice cream on a scale of 1 to 5, or perhaps the number of times that ice creams are consumed each week in the summer months.
You then need to produce summary data for each group, usually mean and standard deviation. These may or may not look quite similar.
In order to decide whether there is a genuine difference between the two groups, you have to use a reference distribution against which to measure the values from the two groups.
The most common source of reference distributions is a standard distribution such as the normal distribution or t- distribution. These two are the same except that the standard deviation of the t-distribution is estimated from the sample, and that of the normal distribution is known.
You then compare the summary data from the two groups and decide the probability of achieving that difference by chance. The lower the probability, the more likely it is that your result is correct. This is referred to as statistical significance.
Types of Error
There are four possible outcomes from statistical testing:
- The groups are different, and you conclude that they are different (correct result)
- The groups are different, but you conclude that they are not (Type II error)
- The groups are the same, but you conclude that they are different (Type I error)
- The groups are the same, and you conclude that they are the same (correct result).
Type I errors are generally considered more important than Type II, because they have the potential to change the status quo.
For example, if you wrongly conclude that a new medical treatment is effective, doctors are likely to move to providing that treatment. Patients may receive the treatment instead of an alternative that could have fewer side effects, and pharmaceutical companies may stop looking for an alternative treatment.
Choosing the Right Test
The test that you use to compare your groups will depend on how many groups you have, the type of data that you have collected, and also how good it is. In general, different tests are used for comparing two groups, and for comparing three or more.
Our page Surveys and Survey Design explains that there are two types of answer scale, continuous and categorical. Age, for example, is a continuous scale, although it can also be grouped into categories.
Gender is a category scale.
- For a continuous scale, you can use the means of the two groups that you are comparing.
- For a category scale, you need to use the medians.
Warning!
If you are not very confident about the quality of the data collected, for example because the inputting was done quickly and cheaply, or because the data have not been checked, then you may prefer to use the median even if the data are continuous to avoid any problems with outliers. This makes the tests more robust, and you can rely on the results more.
What Test?
| Purpose | Data Scale | Average | Test | Test Statistic | Reference Distribution |
| Compare two groups | Continuous | Mean | t-test | t | t |
| Category | Median | Mann-Whitney U test | U statistic | All combination of ranks | |
| Compare three or more groups | Continuous | Mean | Analysis of Variance (ANOVA) | F-ratio | F |
| Category | Median | Kruskal-Wallis Test | W statistic | All combination of ranks |
Source: Easterby-Smith, Thorpe and Jackson, Management Research 4th Edition
One- or Two-Tailed Test
The other thing that you have to decide is whether you are confident of the direction of the distance. In practice, this boils down to whether your research hypothesis is expressed as ‘x is likely to be more than y’, or ‘x is likely to be different from y’. If you are confident of the direction of the distance, then your test will be one-tailed. If not, it will be two-tailed.
Calculating the Test Statistic
For each type of test, there is a standard formula for the test statistic. For example, for the t-test, it is:
(M1-M2)/SE(diff)
M1 is the mean of the first group
M2 is the mean of the second group
SE (diff) is the standard error of the difference, which is calculated from the standard deviation and the sample size of each group.
The final part of the test is to compare the test statistic to that required to meet the desired level of significance (usually 5% or 1%). This value is available from published statistical tables. If the test statistic is that value or more, then the difference between groups is said to be statistically significant at the 5% or 1% level.
NOTE: the significance level is sometimes called the p value, and expressed as p < 0.05 or p < 0.01.
Comparing Variables
Sometimes, you may want to know if there is a link between two variables. If so, you can predict someone’s response to one variable by their response to the other.
- A positive association means that high scores for one variable tend to occur with high scores for the other.
- A negative association means that high scores for one variable tend to occur with low scores for the other.
- There is no association when the score for one variable does not predict the score for the other.
Such associations are also called correlations.
Seeing an Association
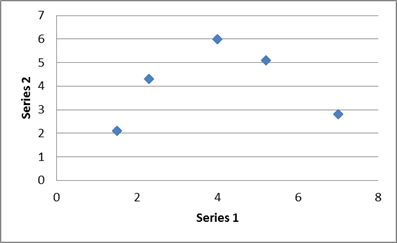
One of the best ways of checking for an association is to draw a line graph of the data with the two variables on the x and y axes. Broadly speaking, if there is an association, you will see it from the graph.
Drawing a graph will also help you identify if there is a peculiar relationship, such as a positive association for part of the data and a negative for the rest, as shown below. This will show in a test as no correlation, but there is clearly some sort of a relationship in this case.
Statistical Tests for Associations
Again, there are specific tests depending on whether you are using continuous, categorical or ranked data.
- For categorical data, you use the chi-squared test (also written χ2)
- For continuous data it is the Pearson product-moment correlation
- For ranks, use the Kendall rank order correlation.
Again, you need to work out the test statistic, and compare that with the value needed to obtain the desired level of significance.
Warning! The Difference Between Correlation and Causation
A correlation is an association between two variables. It does not necessarily imply that one causes the other. Both could be caused by something completely different, or it could simply be that people who show one characteristic often show the other.
For example, it could be that people who shop for groceries online buy more ready-made meals than those who shop in store. However, it is unlikely that the act of buying online causes the purchase of more ready-meals. It is more likely that those who shop online are short of time, and so buy more convenience food, or possibly simply that younger people are both more likely to shop online and more likely to buy convenience food.
A Word of Advice
There are statistical packages available, such as SPSS, which will carry out all these tests for you. However, if you have never studied statistics, and you’re not very confident about what you’re doing, you are probably best off discussing it with a statistician or consulting a detailed statistical textbook.
Badly-done statistical analysis can invalidate very good research. It is much better to find someone to help you.
( ref : http://www.skillsyouneed.com/ )
For written exam/ interview guidance , you may contact:
ANIL AGGARWAL SIR (P.O.-1982 BATCH)
EX CHIEF MANGER ,PUNJAB NATIONAL BANK.
Mobile: +91 9811340788
E-mail ID: anilakshita@yahoo.co.in
Office: Flat #49, Trilok Apartments, Patparganj, I.P. Extension, Delhi-110092.
Follow us at:
Facebook Page: https://www.facebook.com/AnilAggarwalJobguidancehub
Website: http://bankinterview.in/
No comments:
Post a Comment